A new way to see your network.
Traditional "monitoring" only tells part of the story. What about the actual bits on the network?

Get real operational insight.
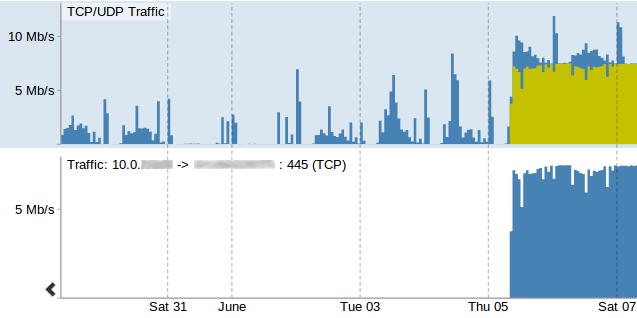
It's easy to prove your point when you've got data to back it up. Show network abuse, bandwidth limitations, security holes, latency issues, application changes, and so much more by slicing and dicing your data.
See historically or in real-time.
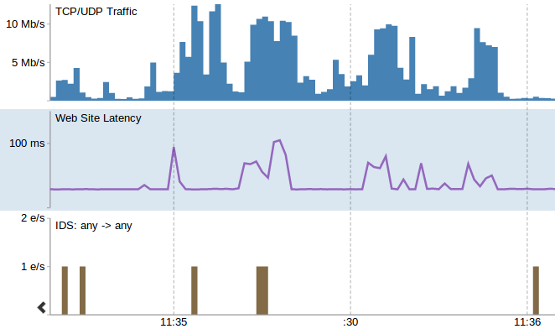
See patterns, trends, and changes to your data over time, or keep an eye on things as they happen. Either way, the Sentry's continuous monitoring capabilities always provide down-to-the-second resolution of traffic, performance, and IDS data.

Learn your network, not the tool.
Security tools can be notoriously difficult to setup and use. The Sentry creates intuitive, interactive visualizations of what is happening on your network. Using these visualizations, the human brain can do what it does best - see patterns.
Compliment "Network Monitoring".
"Network Monitoring" usually means either polling for hardware stats (e.g. disk usage, CPU, bandwidth, etc.) or collecting log and event messages. That's great, but it doesn't tell you much about your actual network traffic. That's where the Sentry, a next-generation traffic analysis tool, comes in. Read our network monitoring white paper to learn more.
Intrigued yet?
Check out how Protectus enables organizations to gain Cyber Confidence™.